

XRP Price Watch: Is a Breakdown Below $2.40 on the Horizon?

XRP is currently trading between $2.42 and $2.44, with a market capitalization of $141 billion and a 24-hour trade volume of $4.29 billion, fluctuating within an intraday range of $2.42 to $2.59.
XRP
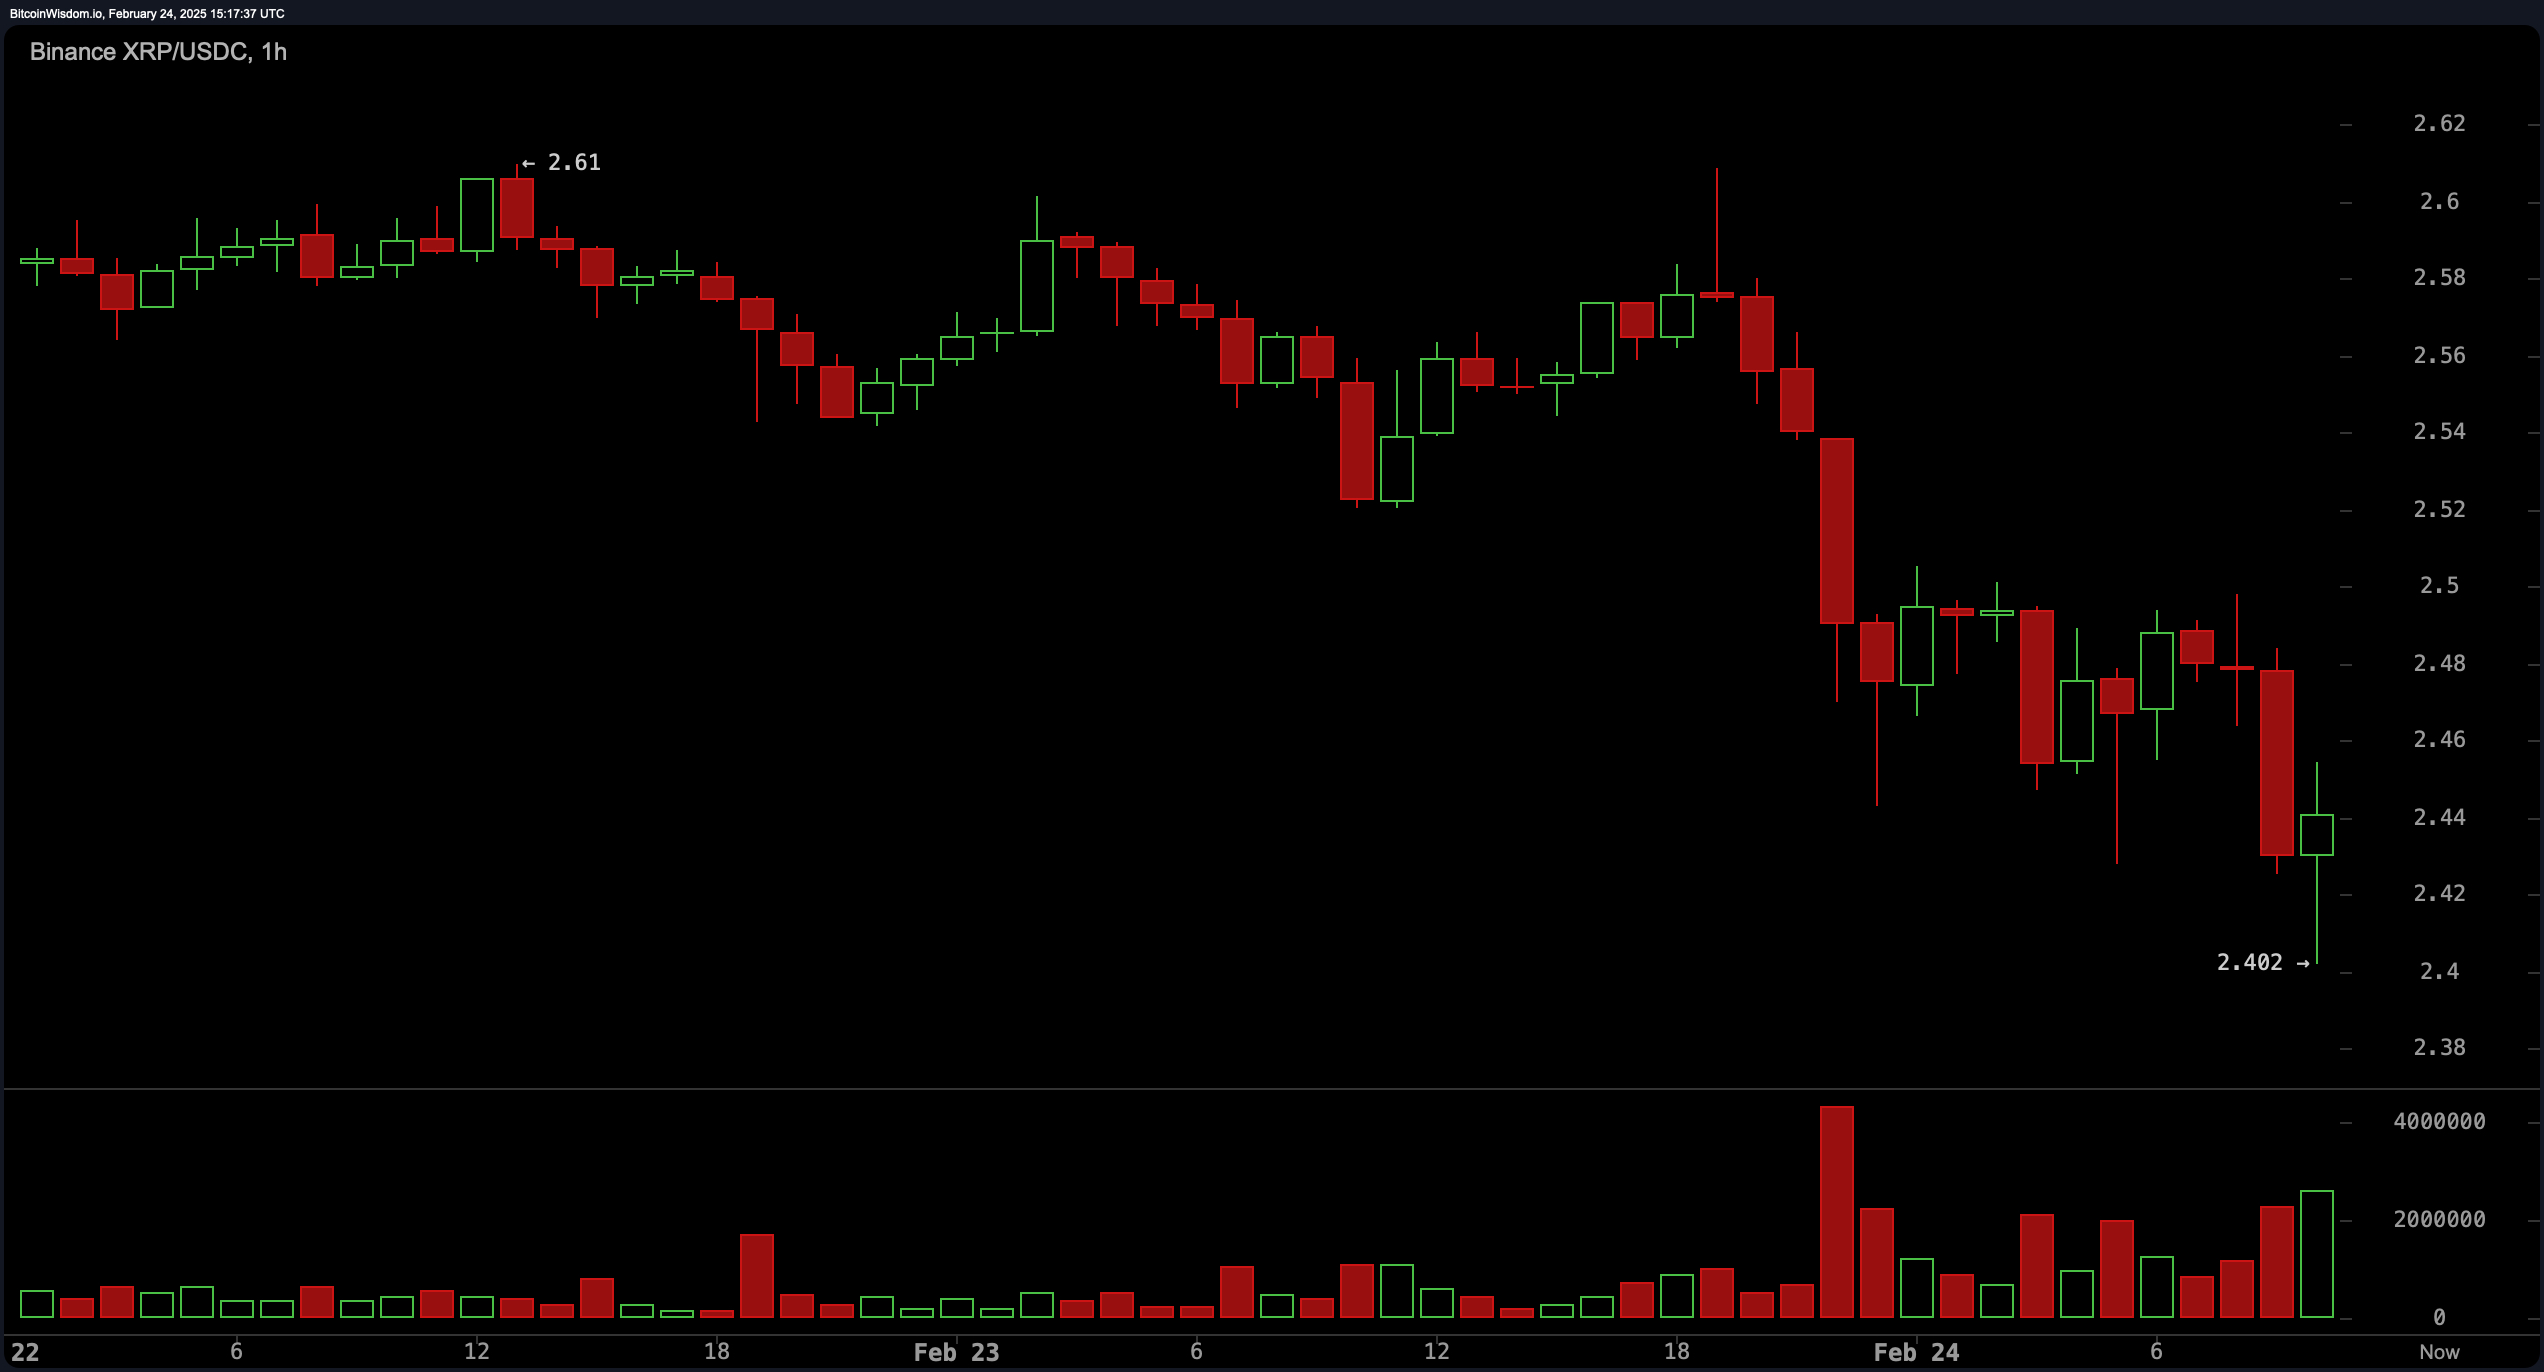
XRP’s one-hour chart reflects short-term bearish momentum, with the digital asset forming lower lows and struggling to break above resistance at $2.5. The support zone between $2.4 and $2.42 has seen multiple tests, while resistance at $2.5 to $2.52 remains intact. Volume analysis shows a pattern of increased selling pressure, with red volume spikes outweighing buying attempts. A rejection at $2.5 could signal further downside toward $2.4, whereas a successful reclaim of $2.45 with bullish candles may drive XRP toward $2.55 to $2.6 in the short term.
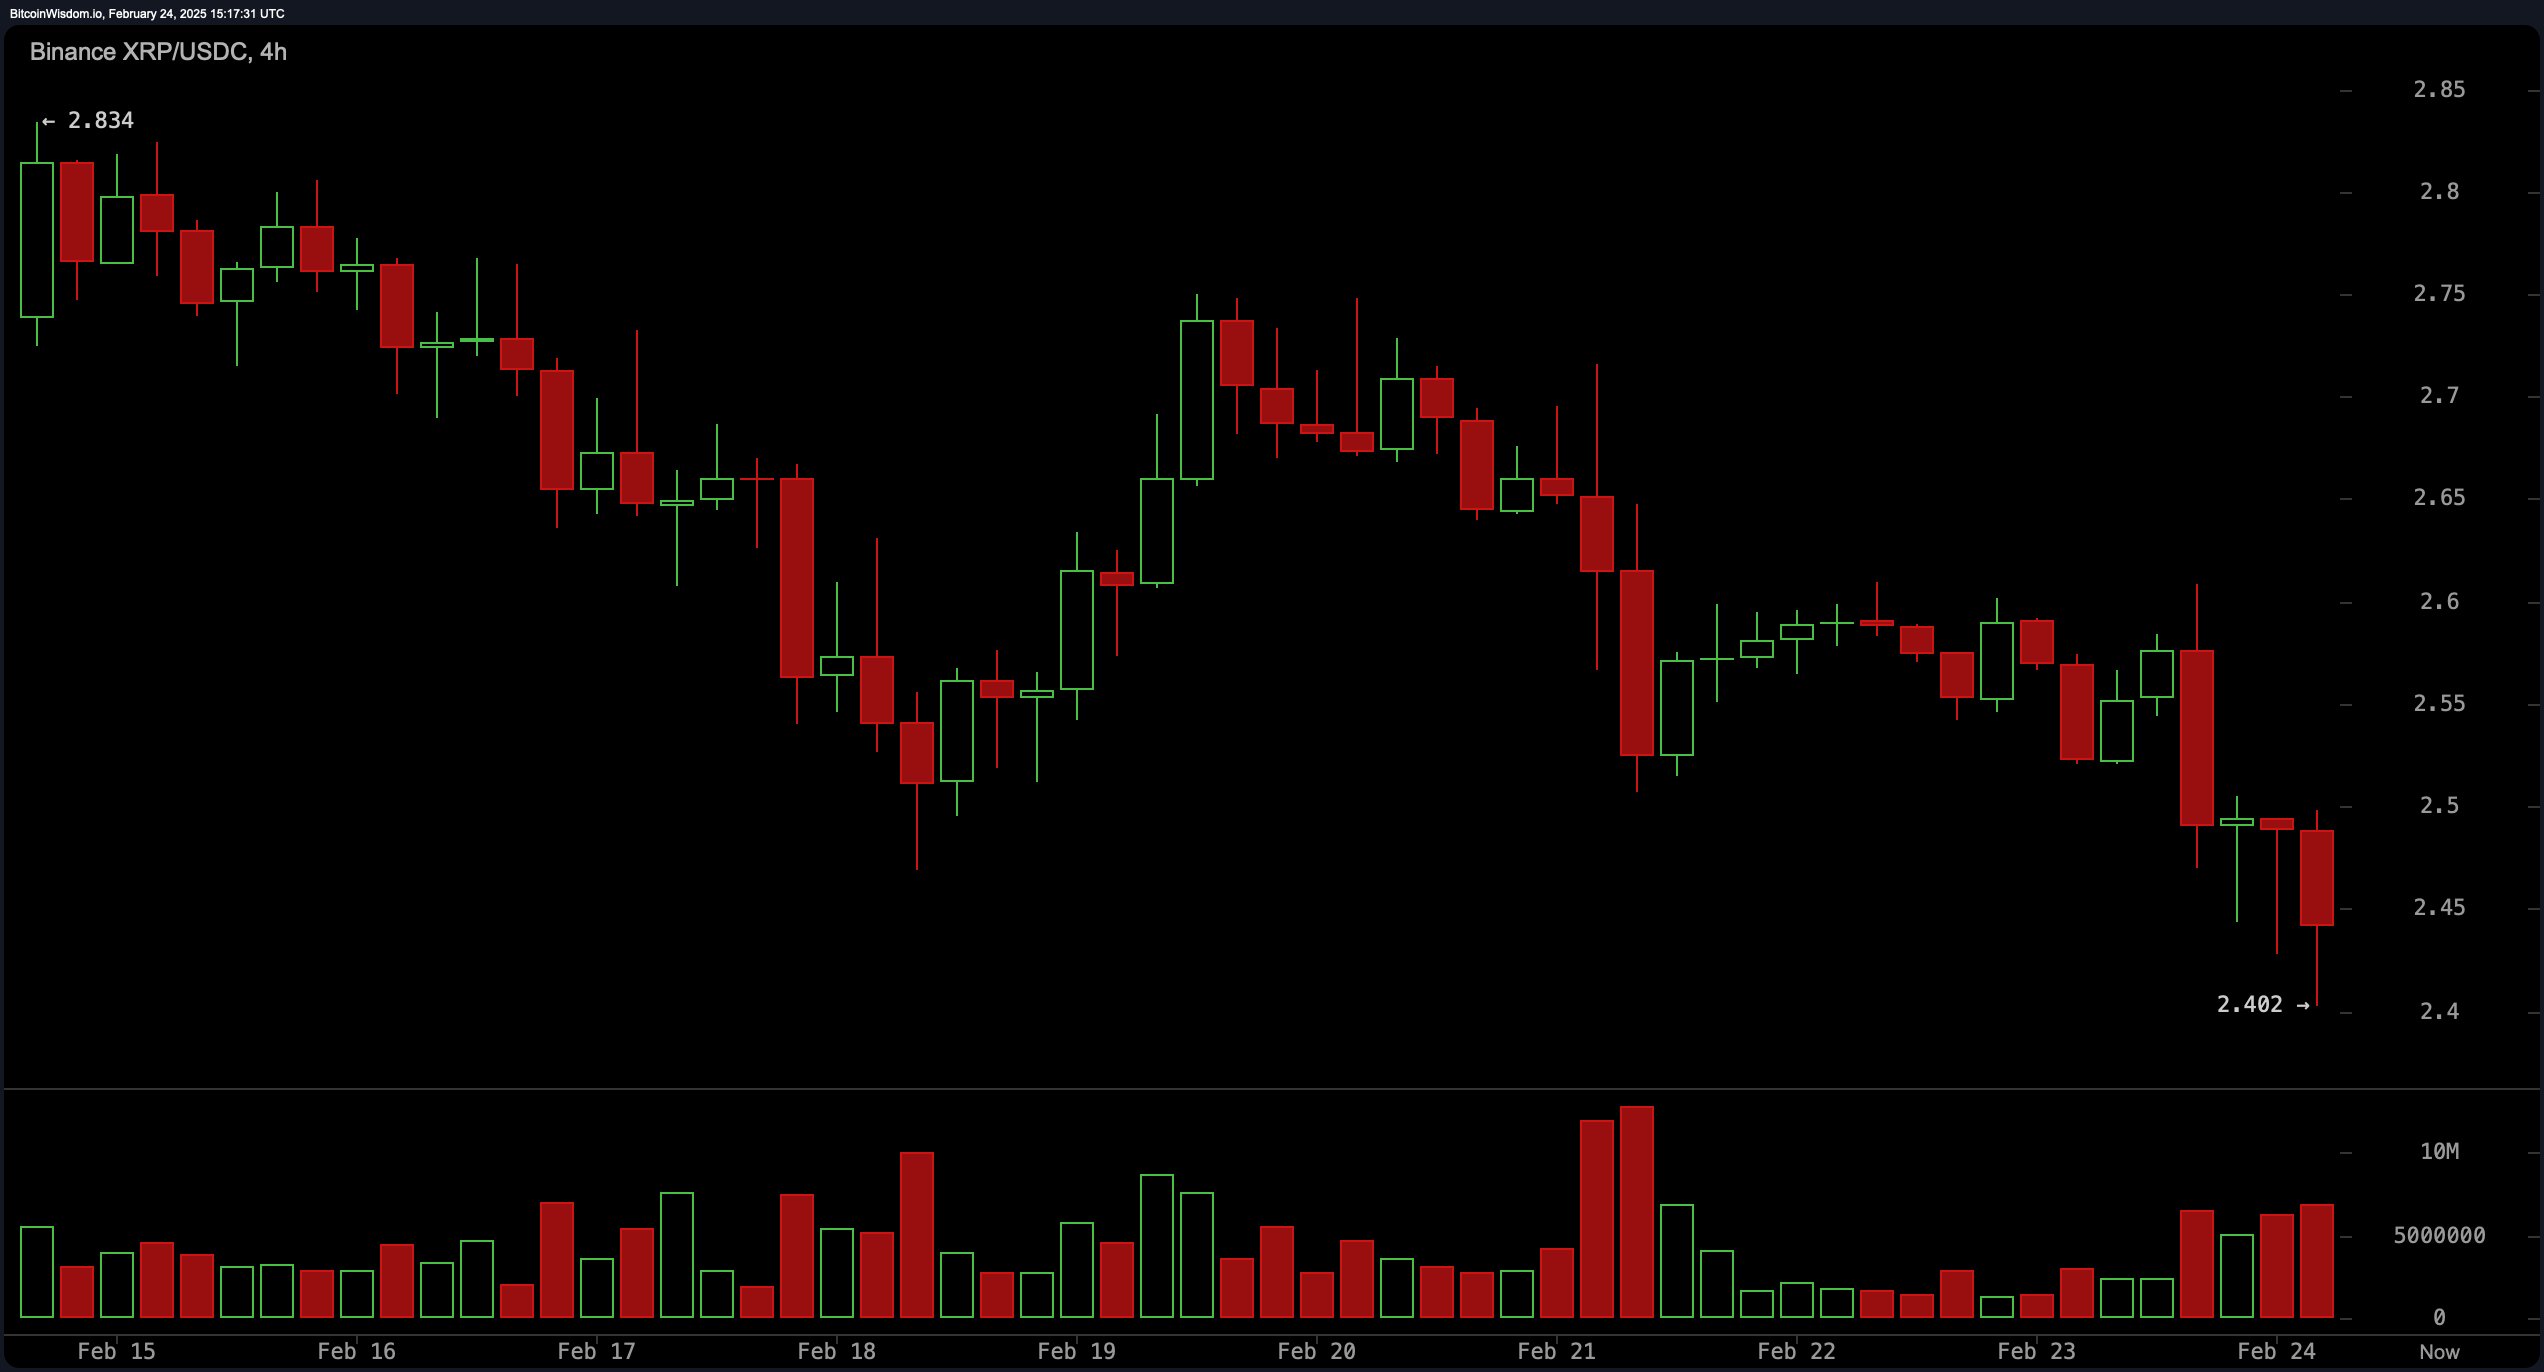
On the four-hour chart, XRP remains in a clear downtrend, having fallen from $2.83 to its current range. Attempts to recover above $2.6 have failed, reinforcing the pattern of lower highs. Increased red volume on recent declines suggests stronger sell-side dominance, while the $2.4 level has held as a key support. A short position could be considered if XRP rejects resistance at $2.55 to $2.6, targeting a drop toward $2.3 to $2.4. A break above $2.6 would challenge the bearish outlook, but confirmation of downward momentum remains a priority for traders.
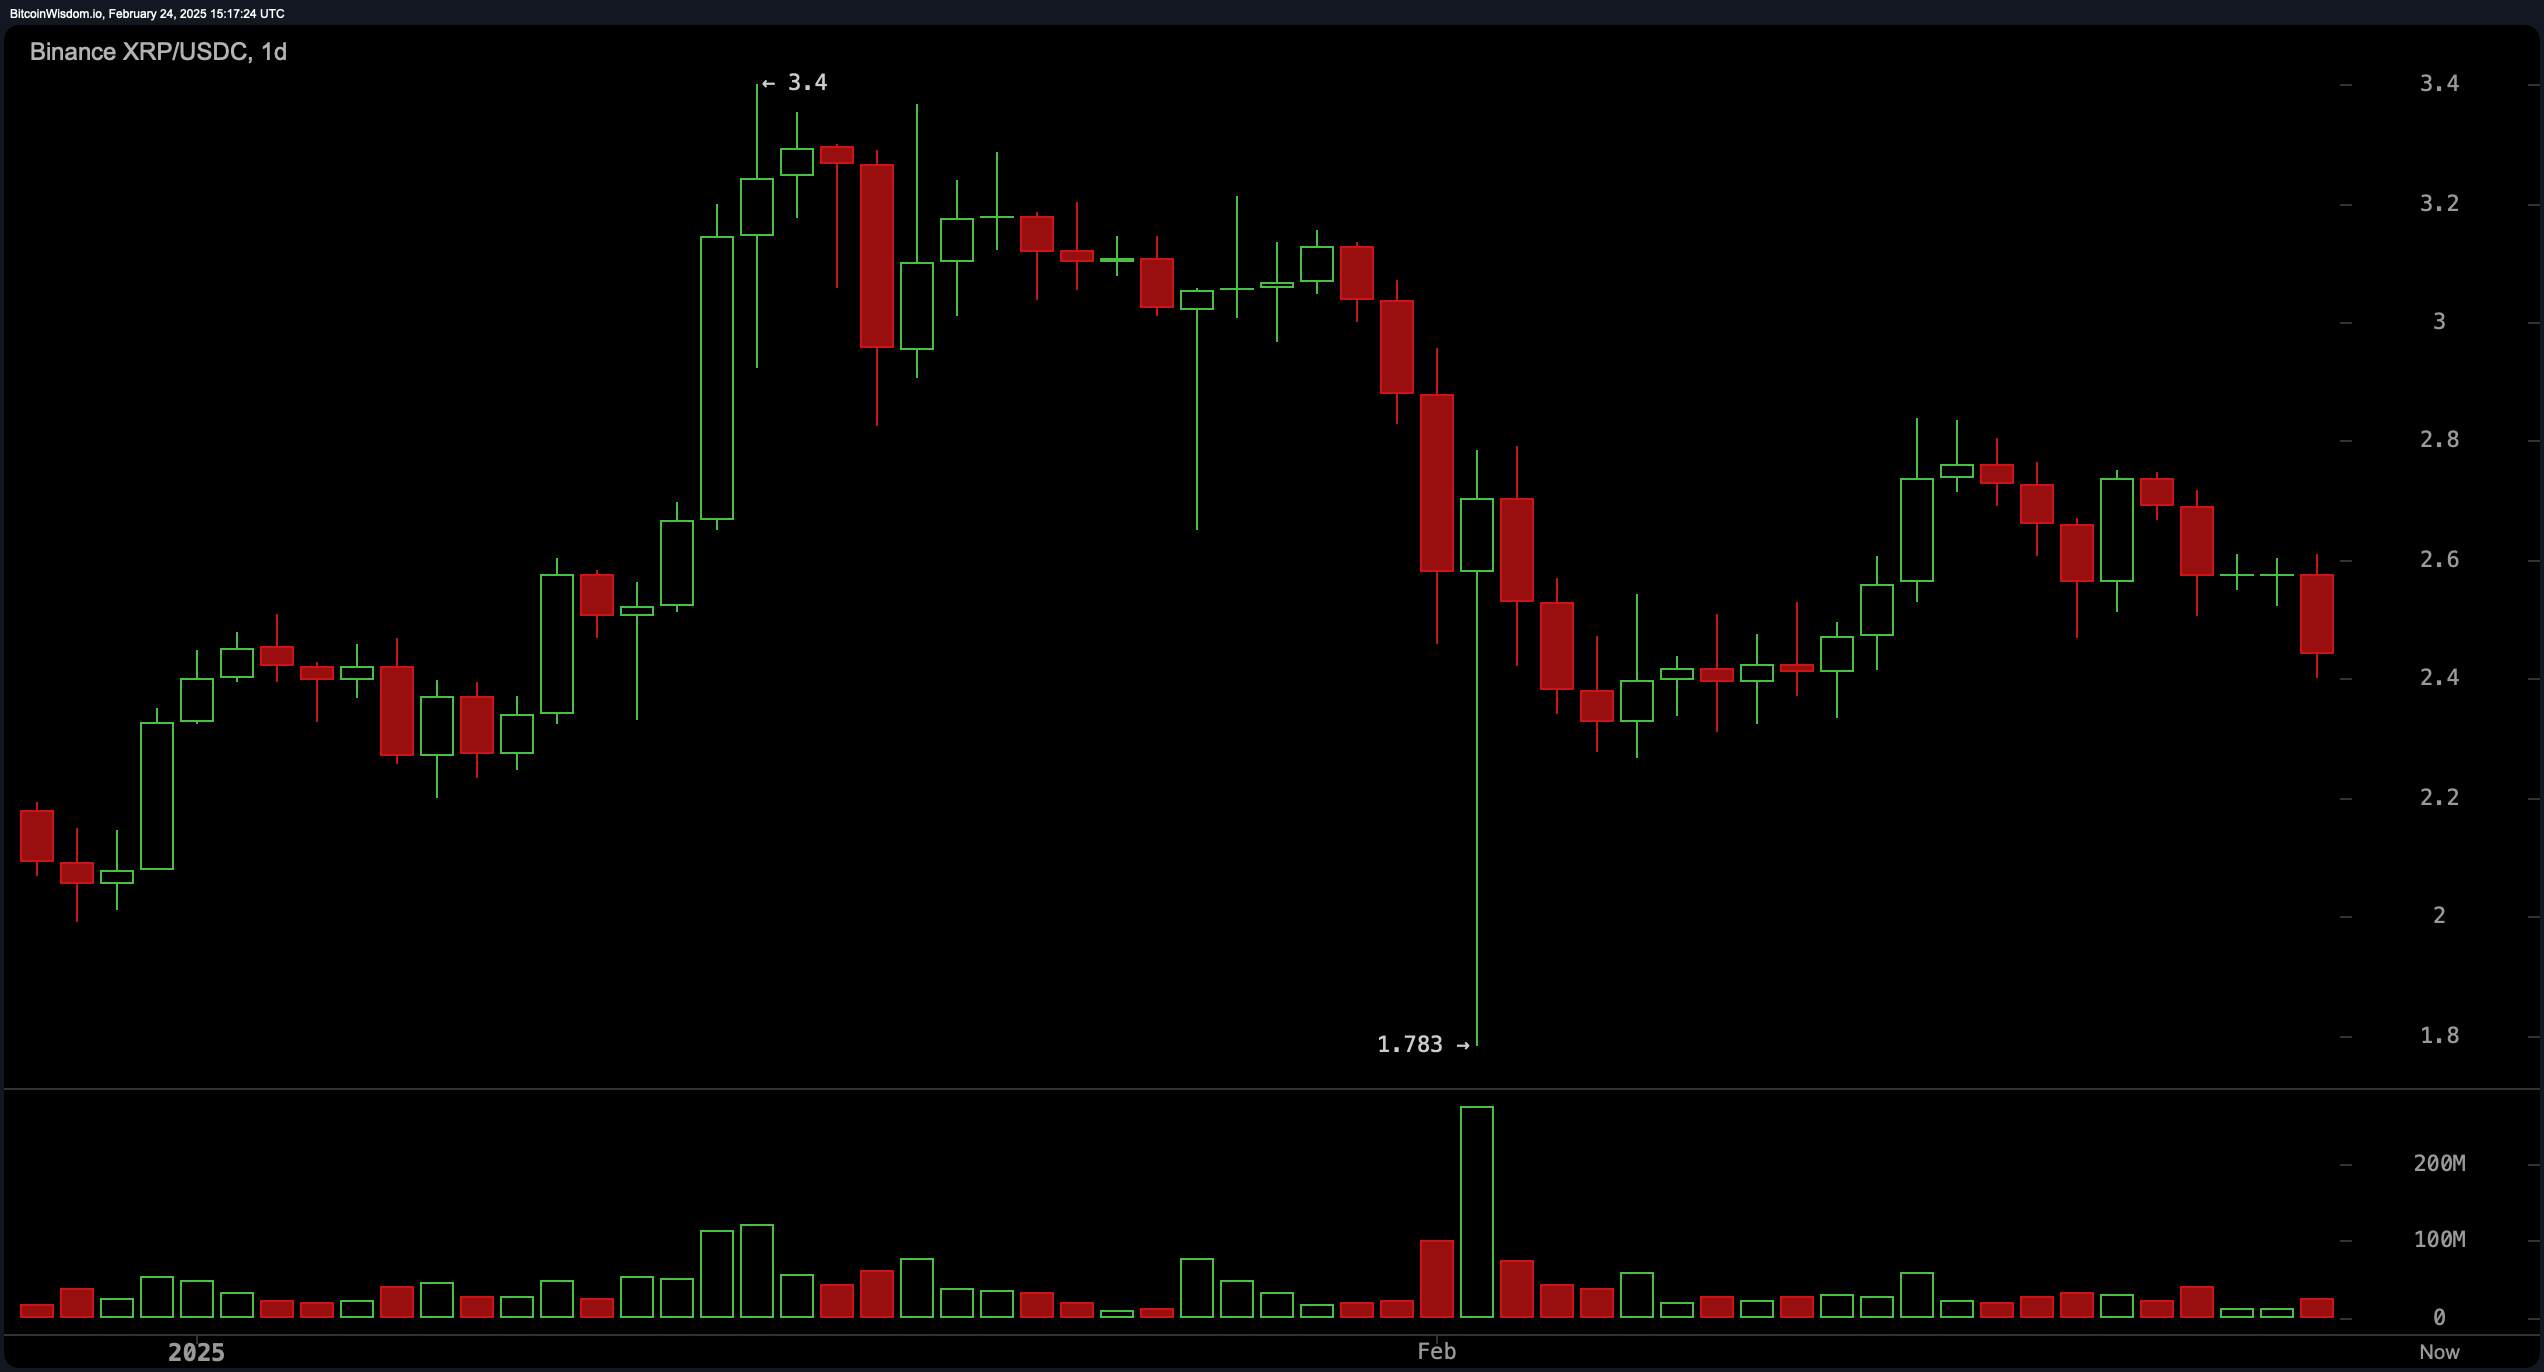
The daily chart highlights a broader trend of declining price action following XRP’s rally to $3.4 and subsequent drop to $1.78. The recent price structure indicates a lower high formation, signaling ongoing bearish pressure despite periodic recovery attempts. The failure to hold above $2.5 increases the risk of further declines, with downside targets extending toward $2.2 or lower. However, if XRP sustains support at $2.4, a potential move toward $2.8 to $3.0 remains possible, though volume trends suggest a cautious approach.
Oscillator readings reflect a mostly neutral stance, with the relative strength index (RSI) at 41.35, Stochastic at 41.11, the commodity channel index (CCI) at -32.28, and the average directional index (ADX) at 30.51. However, the awesome oscillator at -0.118, momentum at -0.287, and moving average convergence divergence (MACD) at -0.037 all indicate a bearish signal, reinforcing the prevailing bearish sentiment.
Moving averages (MAs) suggest continued selling pressure, with the exponential moving average (EMA) and simple moving average (SMA) across 10, 20, 30, and 50 periods all signaling negativity. However, longer-term support emerges with the 100-period EMA at $2.29 and the SMA at $2.40, alongside the 200-period EMA at $1.78 and SMA at $1.48, both issuing positive signals. These indicate that while short-term trends remain bearish, long-term support levels could provide potential reversal zones if selling pressure weakens.
Bull Verdict:
Despite short-term bearish pressure, long-term moving averages suggest that XRP could find strong support at key levels, potentially paving the way for a recovery. If buyers step in at $2.4 and XRP reclaims $2.6, momentum could shift toward an upside target of $2.8 to $3.0, with further gains possible if volume supports the move.
Bear Verdict:
XRP remains under bearish control, with lower highs and persistent selling pressure indicating further downside risk. Oscillator signals and short-term moving averages reinforce the probability of a drop toward $2.2 or lower if $2.4 fails to hold. Without a decisive break above $2.6, the downtrend remains intact, making a retest of lower support levels increasingly likely.